Break It: Physical Testing
Testing Method: Three-Point Bend
The three-point bend test is the most classroom-accessible mechanical test you can run. The setup is simple: your specimen sits on two supports spaced apart at a known distance. You apply a downward load at the center, exactly halfway between the supports. You increase the load until the specimen breaks.
That is it. Two supports, one load point, one formula. The math is straightforward because the geometry of the loading is symmetric. The maximum stress occurs at the bottom surface of the specimen, directly under the loading point. This is where failure begins, and this is what the formula calculates.
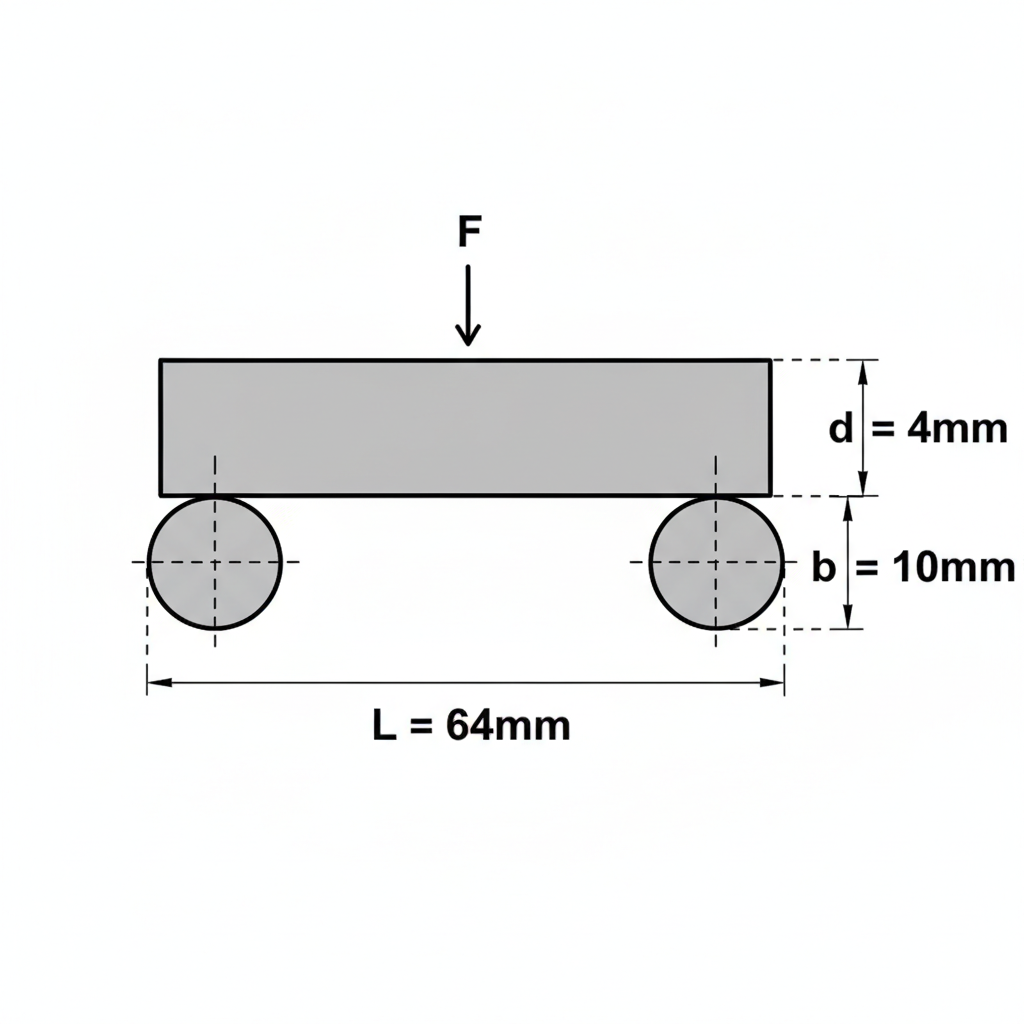
Three-point bend test: specimen on two supports, force applied at center.
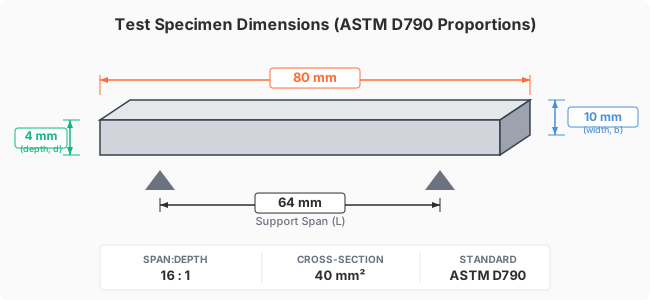
ASTM D790 proportions: 16:1 span-to-depth ratio.
Tensile testing (pulling a specimen apart) requires a dedicated testing machine with grips. Compression testing requires careful alignment to prevent buckling. Three-point bending only requires two supports and a way to push down in the middle. You can build a working test rig from hardware-store materials in under an hour. The standard that governs this test for plastics is ASTM D790.
Test Setup Options
Your teacher will tell you which setup your classroom is using. All three options work. They differ in how you apply and measure the load.
Option A — Dead Weight Loading
Place your specimen on two support pins (steel rod, wooden dowel, or angle iron) separated by the test span. Hang a bucket or container from the midpoint of the specimen using a wire or hook. Add known masses one at a time. After each addition, measure the deflection at the center of the specimen using digital calipers or a dial indicator. Record every load step. Keep adding mass until the specimen breaks. This method is slow and methodical, which makes it excellent for collecting a full force-deflection curve.
Option B — Shop-Built Jig with Press
Mount two support pins on a base plate. Place a bathroom scale or load cell underneath the base. Use a small arbor press or a C-clamp rig to push down on the specimen at the midpoint. Apply load slowly. Watch the scale reading climb until the specimen fractures. Record the maximum force displayed at the moment of failure. This method is faster than dead weights and gives you a clear peak force, but you may not get a full deflection curve unless you pause to measure at each step.
Option C — CNC Kitchen Style
This follows the same principle Stefan Hermann uses. Place a solid rectangular bar on two supports at the correct span. Apply increasing known weights at the center point, one at a time. After each weight, measure how much the bar has deflected downward. Plot force versus deflection. The slope of the straight-line portion of that graph gives you the bending modulus directly. Continue loading to failure if you want the ultimate flexural stress as well.
When the specimen breaks, pieces can fly. Wear safety glasses for every test. Keep your face and fingers away from the loading point. If you are using dead weights, the bucket will drop when the specimen fractures — make sure nothing fragile is underneath it. If you are using a press, release the load slowly after failure.
Span and Support Geometry
These dimensions matter. If you change them, the formula results change. Use the same span for every specimen so your data is comparable across the class.
Support span (L): 64 mm. This gives a 16:1 span-to-depth ratio for a 4 mm thick specimen, which is what ASTM D790 recommends for flexural testing of plastics.
Support pin diameter: Approximately 5–6 mm. Use steel rod or dowel pins. Both supports should be the same diameter.
Loading nose radius: Approximately 5–6 mm. The part that pushes down on the specimen should have a rounded surface, not a sharp edge. A sharp edge creates a stress concentration that does not match the formula's assumptions.
Data Collection
Copy this table into your engineering notebook or use a printed version from your teacher. Fill it in during the test. Do not rely on memory after the fact. Record every load step as it happens.
| Load Step | Applied Mass (g) | Force F (N) = mass × 0.00981 | Measured Deflection δ (mm) | Notes |
|---|---|---|---|---|
| 1 | ||||
| 2 | ||||
| 3 | ||||
| 4 | ||||
| 5 | ||||
| 6 | ||||
| 7 | ||||
| 8 | ||||
| Failure | Describe how it broke |
On the failure row, write down everything you observe. Did the specimen snap cleanly? Did it bend and go white before breaking (stress whitening)? Did layers delaminate? Did it break under the loading nose or off to one side? Take a photo of the broken specimen with a ruler in the frame for scale. This information matters in Section 7 when you compare physical results to your simulation.
Calculations
Once your specimen has broken, you have the numbers you need. There are two key formulas for three-point bending. Both come directly from beam theory.
Flexural Stress at Failure
This tells you the maximum stress on the outer surface of the specimen at the moment it broke.
This is the number you will compare against the yield strength you entered into SolidWorks. If your material properties were accurate, the simulation's predicted stress at failure load should be close to this measured value.
Flexural Modulus (from the Elastic Region)
This tells you how stiff your printed material actually is. You need the force-deflection data from your table to calculate it. Plot Force (y-axis) versus Deflection (x-axis). Find the straight-line portion of the curve — this is the elastic region where the specimen was bending but had not yet started to permanently deform. Measure the slope of that straight line. That slope is m, in units of N/mm.
CNC Kitchen reports a bending modulus of approximately 3,300 MPa for PLA. Compare your calculated Ef to that value, and also compare it to the Young's Modulus you entered in SolidWorks. If all three numbers are in the same ballpark, your simulation inputs were reasonable. If they are far apart, you know something is off — print settings, material quality, or the property values you used.
Worked Example
Suppose your specimen failed at a load of 85 N. The support span is 64 mm, the specimen width is 10 mm, and the specimen thickness is 4 mm.
- Identify your values. F = 85 N, L = 64 mm, b = 10 mm, d = 4 mm.
- Plug into the flexural stress formula. σf = (3 × 85 × 64) / (2 × 10 × 4²)
- Solve the numerator. 3 × 85 × 64 = 16,320
- Solve the denominator. 2 × 10 × 16 = 320
- Divide. 16,320 ÷ 320 = 51.0 MPa
- Interpret the result. The flexural stress at failure was 51.0 MPa. Published flexural strength values for PLA typically range from 48 to 80 MPa depending on print orientation, infill, and filament brand. This result is within that range.
Now suppose that from your force-deflection plot, the slope of the linear region was m = 32 N/mm.
- Identify your values. m = 32 N/mm, L = 64 mm, b = 10 mm, d = 4 mm.
- Plug into the flexural modulus formula. Ef = (64³ × 32) / (4 × 10 × 4³)
- Solve the numerator. 262,144 × 32 = 8,388,608
- Solve the denominator. 4 × 10 × 64 = 2,560
- Divide. 8,388,608 ÷ 2,560 = 3,277 MPa
- Interpret the result. The measured flexural modulus is 3,277 MPa. CNC Kitchen's reported value is approximately 3,300 MPa. These are very close, which means the material stiffness you measured lines up with published data.
If your flexural stress at failure falls between 45 and 80 MPa for PLA, and your flexural modulus falls between 2,800 and 3,800 MPa, your test was executed well. Numbers outside those ranges are not necessarily wrong — but they should prompt you to check your test setup, your measurements, and your specimen quality before moving on.
Unit errors. The formulas expect force in Newtons, lengths in millimeters, and mass conversion using g = 9.81 m/s² (multiply grams by 0.00981 to get Newtons). Mixing up grams and kilograms is the most common source of answers that are off by a factor of 1,000.
Measuring the wrong dimension. The specimen width (b) is the horizontal dimension as it sits on the supports. The depth (d) is the vertical dimension — the direction the load pushes through. Swapping b and d will give you the wrong answer because d is squared in the stress formula and cubed in the modulus formula.
Specimen not centered. If the loading nose is not hitting the exact midpoint between the supports, the stress distribution is asymmetric and the formula does not apply cleanly. Take a moment to center the specimen before loading.
To complete this section, you must have:
- A completed data table with all load steps, forces, and deflections filled in.
- A calculated flexural stress at failure (σf) with all work shown.
- A calculated flexural modulus (Ef) with the slope of your force-deflection curve identified, if your test method provided deflection data.
- A photo of your broken specimen showing the failure location, with a ruler or scale reference in the image.
Record all of this in your engineering notebook. You will need these numbers in Section 7 when you compare your physical test results to the SolidWorks simulation predictions.