The Physics You Need
Stress
Push on anything and it pushes back. That internal resistance, spread across the area it acts on, is stress. A small force on a large area produces low stress. The same force on a tiny area produces high stress. This is why a nail punctures skin but your palm does not.
1 MPa = 1 N/mm². Megapascals and Newtons per square millimeter are the same unit. SolidWorks reports stress in MPa by default, so this is the unit you will use for every calculation in this course.
Strain
When you apply stress to a material, it deforms. Strain measures that deformation as a ratio: how much the length changed divided by the original length. Because it is a ratio of two lengths, strain has no units.
A strain of 0.01 means the material stretched 1% of its original length. A strain of 0.10 means it stretched 10%. Most engineering metals yield well below 1% strain. Polymers can reach 10% or more before they break.
Young's Modulus (Stiffness)
Some materials are stiff (steel, glass). Others are flexible (rubber, silicone). Young's Modulus (E) puts a number on that property. It is the slope of the stress-strain curve in the straight-line region where the material behaves elastically—meaning it springs back when you let go.
Steel: E ≈ 200,000 MPa (200 GPa). PLA filament: E ≈ 3,300 MPa (3.3 GPa). PLA is about 60× less stiff than steel. That does not mean PLA is weak—it means PLA deflects 60× more under the same stress.
Yield Strength
Load a material gently and it bounces back (elastic behavior). Push past a certain stress level and the deformation becomes permanent. The stress at that transition is the yield strength. Below it, the part returns to its original shape. Above it, the part is permanently bent, stretched, or dented. For engineering purposes, exceeding yield strength means the part has failed—even if it has not broken in half.
Yield strength is not the same as breaking strength. A part can yield (permanently deform) long before it fractures. In FEA, you compare your predicted stress to yield strength to decide if a design is safe.
Ultimate Tensile Strength (UTS)
Keep loading past yield and the material enters plastic deformation—it is permanently changing shape. The highest stress the material reaches before it fails is the Ultimate Tensile Strength (UTS). After UTS, the material necks down (thins in one spot) and fractures. UTS tells you the absolute ceiling of what the material can withstand. You should never design to this limit. That is what Factor of Safety is for.
Factor of Safety
Engineers do not design parts that barely survive. They build in a margin. Factor of Safety (FoS) is the ratio of how strong the material is to how much stress you are actually putting on it.
- FoS > 1.0 — The part is predicted to survive. Higher is safer.
- FoS = 1.0 — The part is at its exact limit. No margin. Not acceptable.
- FoS < 1.0 — The applied stress exceeds yield strength. The part will permanently deform or break.
For student projects using 3D-printed polymers, a minimum FoS of 2.0 is a reasonable starting target. Safety-critical aerospace parts often require FoS of 1.5 with extensive testing. Consumer products might use 3.0 or higher. The right number depends on consequences of failure and how well you trust your material data.
The Stress-Strain Curve
Everything above fits onto one graph. The stress-strain curve is the single most important diagram in materials engineering. You plot stress (σ) on the vertical axis and strain (ε) on the horizontal axis, then pull a sample until it breaks. The shape of that curve tells you everything about how the material behaves.
Reading the Curve, Region by Region
- Elastic Region (straight line) Stress and strain increase together in a straight line. Remove the load and the material returns to its original shape. The slope of this line is Young's Modulus (E). A steeper line means a stiffer material.
- Yield Point (the bend in the curve) The curve stops being straight. Beyond this point, removing the load will not bring the material back to its original shape. The stress value here is the yield strength. This is the number FEA compares your applied stress against.
- Plastic Region (the curved portion) The material is permanently deforming. It may still be getting stronger (strain hardening), but the damage is done. The peak of this curve is Ultimate Tensile Strength (UTS).
- Fracture (the X) The material breaks. In ductile materials, the sample necks down (thins locally) before snapping. In brittle materials, fracture happens suddenly with little warning—sometimes right at the yield point.
Ductile vs. Brittle Failure
How a material fails matters as much as when it fails. There are two fundamentally different failure modes.
Brittle Failure
The material snaps with little or no plastic deformation. There is almost no warning. The stress-strain curve goes straight up and then drops. PLA is a brittle polymer: load a PLA hook and it holds, holds, holds—then snaps clean. The break is sudden and the fracture surface is smooth.
Ductile Failure
The material stretches, bends, and visibly deforms before it breaks. You get warning. PETG is a ductile polymer: load a PETG hook and it bends, elongates, turns white at the stress point (crazing), and eventually tears. It may never fully snap in half.
Stefan from CNC Kitchen tested identical hook geometries printed in PLA, PETG, and ASA. PLA held the most weight (73 kg horizontal) but snapped instantly at failure. PETG held less (55 kg) but stretched visibly before failing. ASA snapped like PLA but absorbed more impact energy due to rubber particles in its microstructure. These results appear in the data table below.
Why Different Filaments Behave Differently
You do not need to become a chemist. But you do need to understand why PLA snaps while PETG bends. The answer is in the molecular structure.
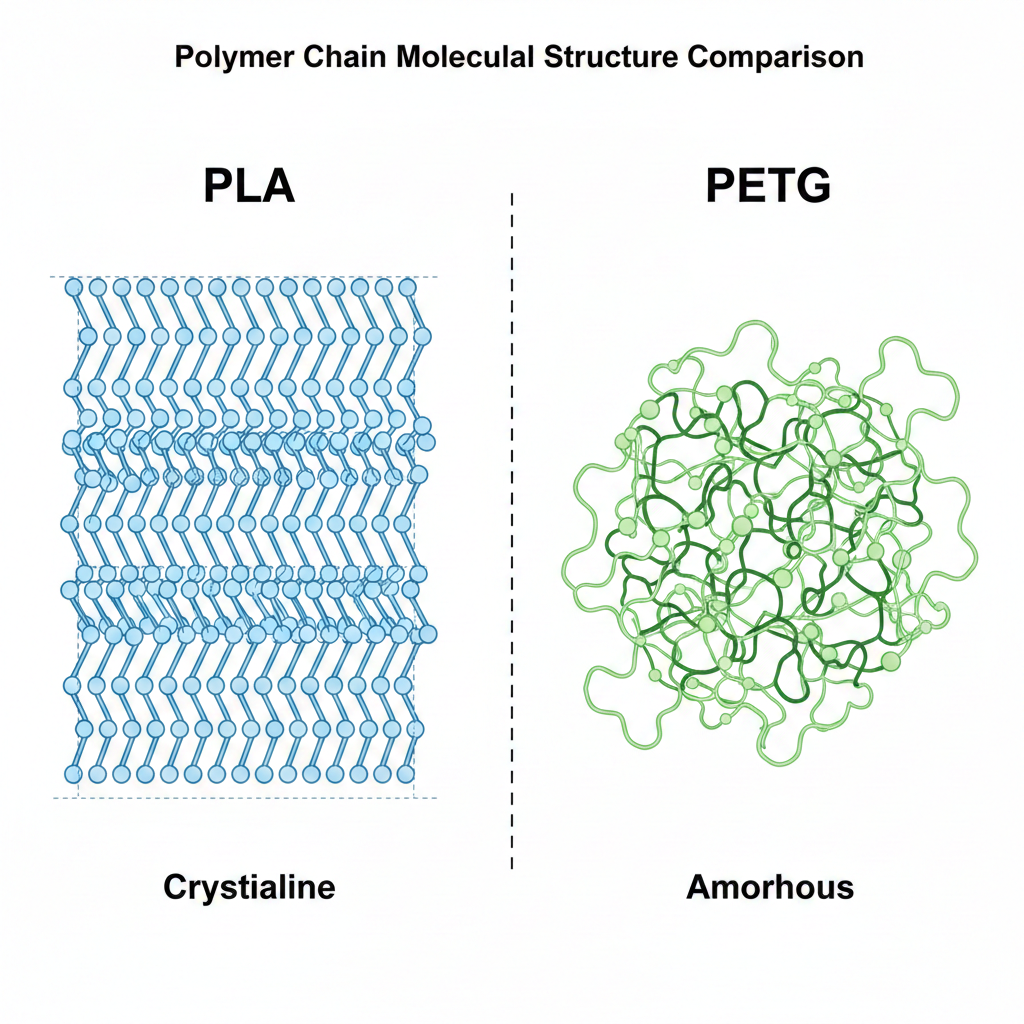
Crystalline chains (PLA) pack tight and snap. Amorphous chains (PETG) tangle and flex.
PLA — Stiff but Brittle
PLA (polylactic acid) has high crystallinity—its polymer chains pack tightly into ordered regions. Ordered packing means high stiffness (3,300 MPa bending modulus) but almost no ability to absorb energy before fracture. PLA also has a low glass transition temperature (~60°C), which means it softens in a hot car or under sustained friction. High stiffness, low toughness, low heat resistance.
PETG — Flexible and Tough
PETG is PET (the stuff water bottles are made of) modified with glycol. The glycol modification disrupts crystallization, making PETG largely amorphous—its chains are tangled rather than ordered. Tangled chains slide past each other under load, which is why PETG stretches instead of snapping. Lower stiffness (1,900 MPa), but much higher elongation at break.
ABS/ASA — Impact Tough
ABS contains butadiene rubber particles dispersed throughout its structure. When a crack tries to propagate through ABS, it hits a rubber particle that absorbs the energy and blunts the crack tip. This is why ABS has high impact strength (18 kJ/m² notched Izod versus 5 kJ/m² for PLA). ASA replaces butadiene with acrylic rubber for UV resistance but works the same way. The trade-off: ABS is harder to print and warps more.
Why 3D-Printed Parts Are Different
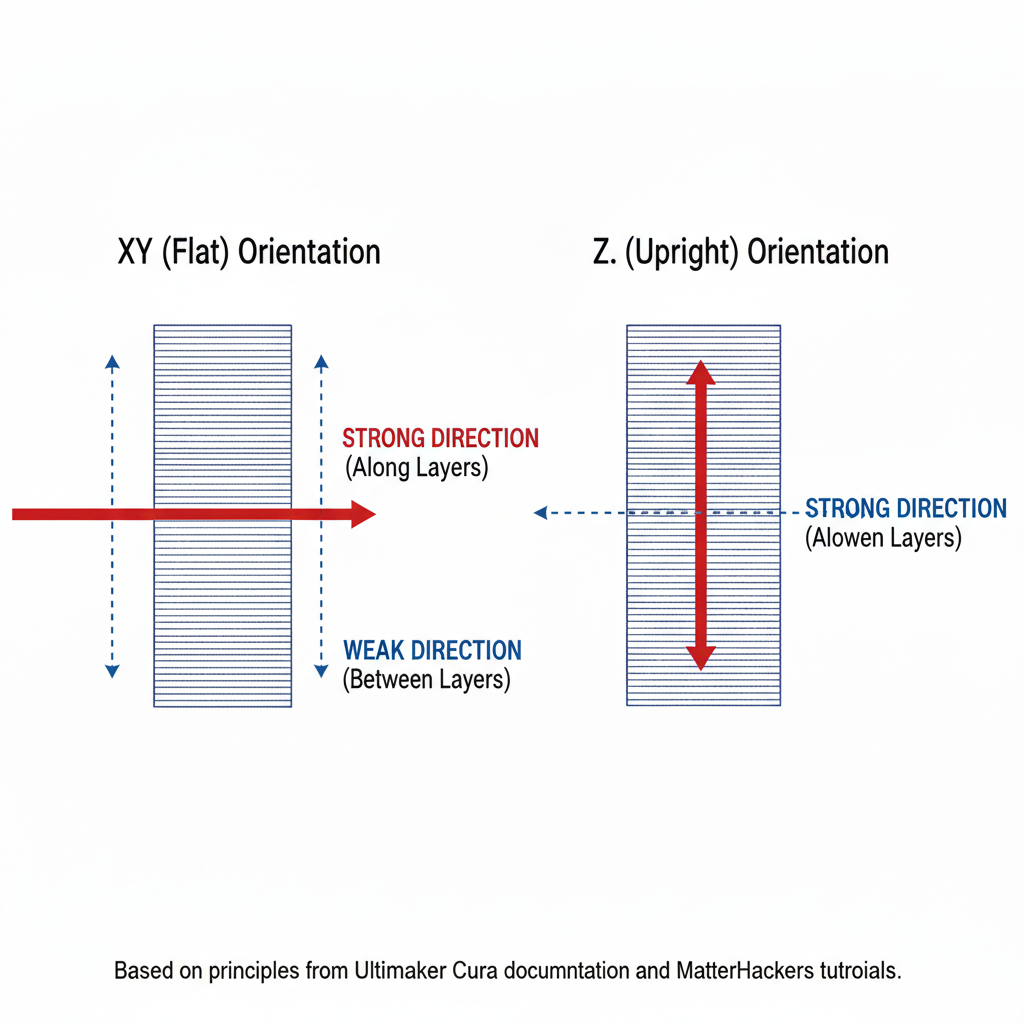
Print orientation determines where the weak layer bonds fall relative to your load.
Injection-molded parts are roughly the same strength in every direction (isotropic). 3D-printed FDM parts are not. Each layer bonds to the layer below it through heat, and that bond is always weaker than the solid material within a single layer. The result is anisotropy—the part is strong along the print lines (X/Y) and weak between layers (Z).
Think of it like wood: strong along the grain, easy to split across it. This is why print orientation matters enormously in FEA and in real life. A hook printed so that layers stack perpendicular to the load will fail at roughly half the force of the same hook printed with layers parallel to the load.
Look at the CNC Kitchen data table. The "Vertical hook failure" row shows what happens when layers are stacked perpendicular to the load direction. Every material loses strength, but some lose more than others. ABS drops to 29% of its horizontal capacity. PLA retains 55%. This is the anisotropy penalty, and it is different for every material.
Material Comparison: CNC Kitchen Data
| Property | PLA | PETG | ASA/ABS |
|---|---|---|---|
| Bending modulus | 3,300 MPa | 1,900 MPa | 2,300 MPa |
| Horizontal hook failure | 73 kg | 55 kg | 57 kg |
| Vertical hook failure | 40 kg (55%) | 25 kg (46%) | 17 kg (29%) |
| Impact strength (notched Izod) | 5 kJ/m² | 8.6 kJ/m² | 18 kJ/m² |
| Thermal failure onset | 60°C | 80°C | 110°C |
| Failure behavior | Brittle snap | Stretches, never fully snaps | Brittle snap |
PLA wins on raw stiffness and horizontal load capacity. PETG wins on ductility—it bends rather than breaks. ABS/ASA wins on impact resistance and heat tolerance. No single material is best at everything. Choosing the right filament means knowing which property matters most for your application.
Calculate the following using the formulas from this section. Show your work with units.
- Stress calculation. A 3D-printed PLA bracket has a cross-sectional area of 80 mm² at its thinnest point. It must support a load of 200 N. What is the stress at that cross-section?
- Strain calculation. A PETG tensile specimen has an original gauge length of 50 mm. Under load, the gauge section stretches to 51.2 mm. What is the strain? Express it as both a decimal and a percentage.
- Factor of Safety. The PLA bracket from Problem 1 is made from filament with a yield strength of 50 MPa. Using the stress you calculated, what is the Factor of Safety? Would you trust this design for a load-bearing application? Why or why not?