Reading Results
Von Mises Stress Plot
After the solver finishes, the first plot SolidWorks shows you is usually the Von Mises stress plot. This is the most important result to understand.
Von Mises stress is a single combined-stress number calculated at every point in your part. It accounts for tension, compression, and shear all acting at the same time and rolls them into one value measured in megapascals (MPa). The reason we use it is simple: real-world loads rarely produce pure tension or pure compression alone. Von Mises gives us one number we can compare directly to the material's yield strength.
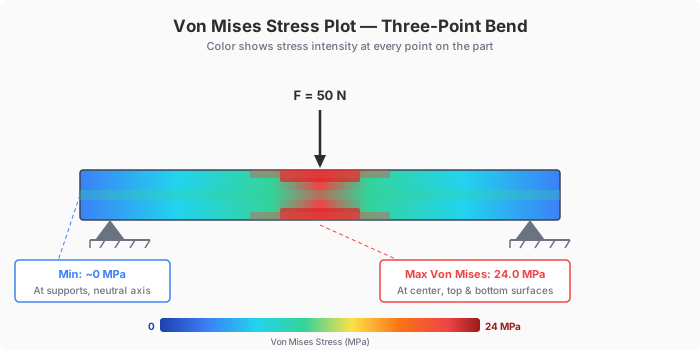
Von Mises stress on a test bar under three-point bending. Red = high stress at center. Blue = low stress near supports.
The plot uses a color spectrum. Red regions carry the highest stress. Blue regions carry the lowest. Everything in between falls on a gradient. But the colors alone tell you nothing — you must read the legend on the side of the plot to know what values the colors represent.
Always read the legend. The same shade of red could mean 10 MPa on one plot and 500 MPa on another. SolidWorks auto-scales the color range to fit your specific results, so two different parts will have completely different scales. Never compare colors across plots — compare numbers.
When you look at the plot, ask yourself three questions:
- Where is the red region? That is the most stressed location on the part.
- What is the maximum Von Mises stress value? Read the number at the top of the legend or use the probe tool to click the red spot directly.
- Is that maximum stress below the material's yield strength? If yes, the part is predicted to survive the load. If no, it is predicted to fail at that location.
Displacement Plot
The displacement plot shows how far each point on the part moves under the applied load, measured in millimeters. This tells you how much the part bends, stretches, or compresses. The color scale works the same way as the stress plot: red means the most movement, blue means the least (usually zero at a fixture).
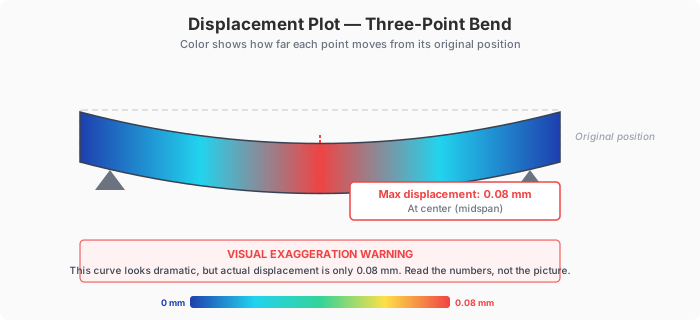
Displacement plot with visual exaggeration. The curve looks dramatic, but actual deflection is only 0.08 mm.
Displacement matters because even if a part does not break, it might flex too much to function properly. A shelf bracket that bends 5 mm under load is not broken, but it is probably not acceptable either.
SolidWorks exaggerates deformation visually. The deformed shape on your screen might look like the part bent 10 mm when the actual displacement value is 0.02 mm. The software scales up the deformation so you can see the shape of the deflection, but it does not represent the real magnitude. Read the numbers in the legend, not the picture. If you need to see the true-scale deformation, right-click the plot and change the deformation scale to 1:1.
Factor of Safety Plot
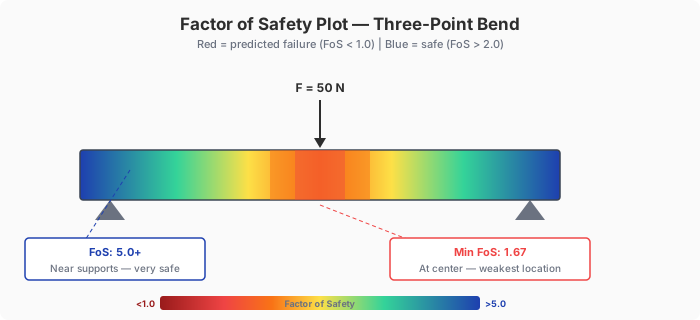
Factor of Safety: blue = safe, red = at risk. The minimum FoS is where the part fails first.
The Factor of Safety (FoS) plot shows the ratio of yield strength to Von Mises stress at every point on the part. You already know the formula from Section 1:
The color coding on this plot is the reverse of what you might expect:
| Color | FoS Range | Meaning |
|---|---|---|
| Red | Below 1.0 | Failure predicted — stress exceeds yield strength at this location. |
| Yellow / Green | 1.0 – 2.0 | Survives, but with a thin margin. Any unexpected extra load could cause failure. |
| Blue | Above 2.0 | Comfortable margin — the part is well within its capacity at this location. |
The single most useful number on this plot is the minimum FoS and where it occurs. That location is the weakest point on the part — the place that will fail first if the load increases. Use the probe tool or read the bottom of the legend to find the minimum value.
A minimum FoS of exactly 1.0 means the part is right at the edge — any small increase in load, any material defect, or any manufacturing variation could push it into failure. In professional engineering, most designs target a minimum FoS of 1.5 to 3.0 depending on the application and consequences of failure.
Singularities and Artifacts
Sometimes you will see an extremely high stress value concentrated at a sharp interior corner in your model. The stress might be two or three times higher than anywhere else on the part, and the red spot is just a single tiny point. Before you panic, check whether this is a singularity.
A singularity is a math artifact, not a real physical phenomenon. It happens because sharp 90-degree interior corners create a theoretical infinite stress concentration. When FEA tries to calculate stress at that exact corner, the answer keeps climbing as you make the mesh finer. There is no correct answer — the math just diverges to infinity.
Here is how to tell the difference between a singularity and a real stress concentration:
| Real Stress Concentration | Singularity (Artifact) | |
|---|---|---|
| Mesh refinement | Stress converges to a stable value as mesh gets finer. | Stress keeps growing with no limit as mesh gets finer. |
| Affected area | Stress is elevated over a visible region around the feature. | The extreme value is confined to one or two elements at the exact corner. |
| Geometry | Occurs at fillets, holes, notches — features with actual geometry. | Occurs at perfectly sharp interior corners with zero fillet radius. |
Add a fillet to the sharp corner. Even a small radius (0.5 mm) eliminates the singularity and lets FEA calculate a real, finite stress value. This is good design practice anyway — sharp interior corners are stress concentrators in real parts too, and fillets make parts stronger.
The Prediction
You now have everything you need to make a prediction about your part. Before you send it to the 3D printer, you need to write down what you expect to happen when you test it physically. This is your hypothesis. The physical test in Section 6 is the experiment.
Before printing your specimen, record the following from your simulation results at your chosen test load:
- Predicted maximum Von Mises stress — the peak value from your stress plot, in MPa.
- Predicted maximum displacement — the peak value from your displacement plot, in mm.
- Predicted Factor of Safety — the minimum FoS value from your FoS plot.
- Predicted failure location — describe where on the part you expect failure to occur (for example, "the fillet on the underside near the left support").
This is your hypothesis. Write it clearly, with units and specific locations. In Section 6, you will load the real part and compare your prediction to what actually happens. The quality of your engineering analysis depends on making this prediction before you see the real results — not after.
A classmate runs a simulation on a different bracket design and gets the following results at a 50 N load:
- Maximum Von Mises stress: 35 MPa, located at the fillet near the fixed end
- Material yield strength (PLA): 40 MPa
- Maximum displacement: 0.15 mm, at the tip where the load is applied
- Minimum Factor of Safety: 1.14, at the fillet near the fixed end
Using these results, answer the following:
- Where on the part is the stress highest?
- Where on the part is the displacement greatest, and how far does that point move?
- What is the minimum Factor of Safety, and where does it occur?
- Write two sentences summarizing whether this part survives the 50 N load. Include specific numbers in your answer.